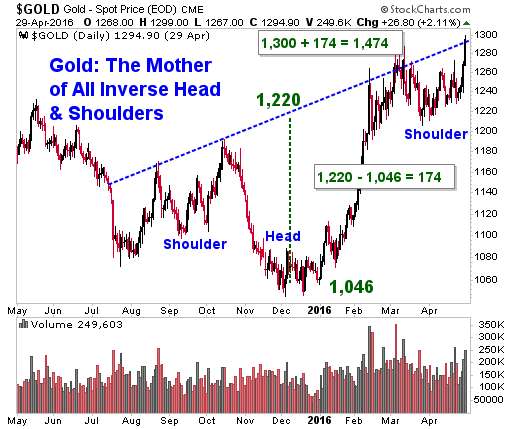
It sure looks like we're seeing an inverse head-and-shoulders pattern developing in $GOLD. My target is $1,474.
(Updated chart)
For an inverse head and shoulders pattern to work, heavy volume on the breakout through the neckline is a must. And that’s just what we’re seeing now. Remember, “volume should move with trends, not against them.”
After breaking neckline resistance, the price target is found by measuring the distance from the neckline to the bottom of the head. This distance is then added to the point at which the pattern breaches the neckline to reach a price target. Any price target should serve as a rough guide. Other factors (previous resistance levels, etc) should be considered.
They say “every sunken ship has a chart.” So don’t bet all your pin money on this.
On the bright side, chart analysis CAN be an indicator of potential price action. As a reminder, here’s the chart I sent around in February, when the gold bull market first started.

We'll see if it works out this time. A weaker dollar certainly helps gold go higher, and I made the case for the dollar going much lower in a previous post.
Good luck and good trades.
No comments:
Post a Comment