Here's an update of a chart I posted a while back. You can see that Industrials, as tracked by the XLI, broke out early in May. The rally stalled, and on Tuesday XLI came back to test the former downtrend. It seems to have successfully tested it as support, though we need XLI to move above Tuesday's candle to confirm this.
 (Updated chart)
Conservative investors will wait for a breakout over the highs it made last week.
(Updated chart)
Conservative investors will wait for a breakout over the highs it made last week.
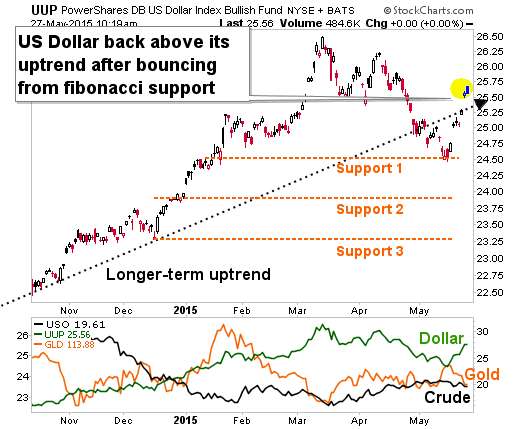
We can see that the US Dollar (as tracked by UUP) is back above its uptrend. It bounced successfully from Fibonacci support.
 (Updated chart)
That's plainly bullish. And gold hates a dollar rally. Though just to be a pain in the butt, the dollar opened higher today and is now fading. Throw those chicken bones, they'll be just as predictive here.
(Updated chart)
That's plainly bullish. And gold hates a dollar rally. Though just to be a pain in the butt, the dollar opened higher today and is now fading. Throw those chicken bones, they'll be just as predictive here.
It's time to check in on my favorite chart of the US Dollar Index, as tracked by the PowerShares DB US Dollar Index Bullish Fund (UUP) ...
 (Updated chart)
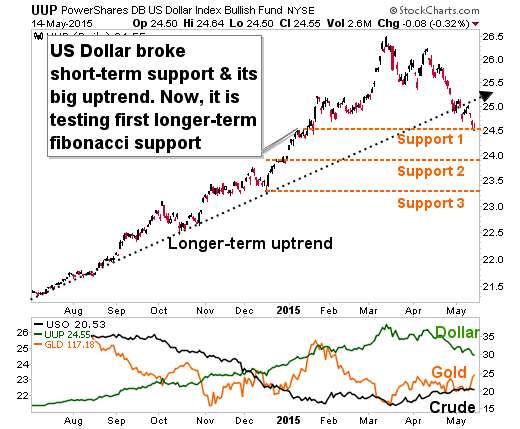
Here is commentary I sent my $10 Trigger Alert subscribers along with this chart on Tuesday ...
You can see the dollar broke its big uptrend and went to test support at its first Fibonacci support level. Fibonnacci numbers are named after a 13th-century mathematician Leonardo Bonacci Fibonacci. He was the first to notice that these numbers and their ratios appear in nature over and over again. For better or worse, technical analysts use these numbers in trading all the time.
I think technicians saw the US dollar test its Fibonacci support and bought it for a quick rally. But the fundamentals of the US dollar haven’t changed …
(Updated chart)
Here is commentary I sent my $10 Trigger Alert subscribers along with this chart on Tuesday ...
You can see the dollar broke its big uptrend and went to test support at its first Fibonacci support level. Fibonnacci numbers are named after a 13th-century mathematician Leonardo Bonacci Fibonacci. He was the first to notice that these numbers and their ratios appear in nature over and over again. For better or worse, technical analysts use these numbers in trading all the time.
I think technicians saw the US dollar test its Fibonacci support and bought it for a quick rally. But the fundamentals of the US dollar haven’t changed …
- The long dollar trade is the most overbought trade in the world
- The US economy is showing signs of weakness while Europe and Japan are showing signs of coming back to life
- Guesstimates of when the US Federal Reserve will next raise benchmark interest rates are being pushed further into the future.
So, it’s likely the dollar will bang its head on its former uptrend, which has turned into overhead resistance.
That’s the big picture. In the shorter-term, smaller picture, gold and silver are taking it on the chin today. Since gold and silver are priced in dollars, they often go down when the dollar goes up.
The good news is we could see another buying opportunity ... (sorry, the rest, including my estimate on when that buying opportunity will come, is for subscribers)
Update: The FOMC meeting notes were positively doveish.
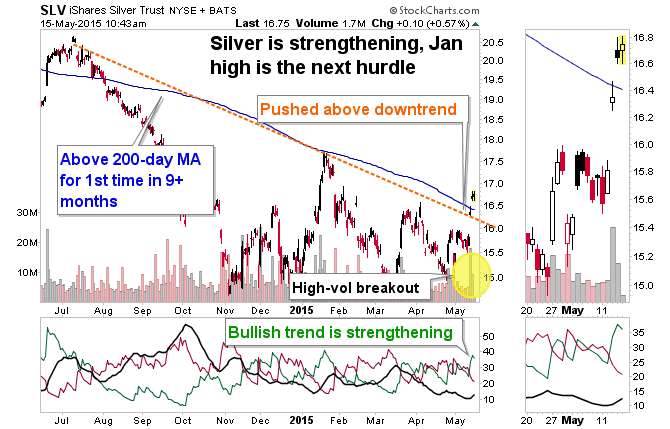
Here is my latest chart analysis on silver, using the iShares Silver Trust (SLV) ...
(Updated chart)
Some pertinent stories ...
My price target for silver is $25. What's my time frame? That's for subscribers, thanks.
Needless to say, price action in silver and gold -- at least for us damned yankees -- has a lot to do with the U.S. dollar. Here's my latest on THAT.
Let's look at a chart of the PowerShares DB US Dollar Index Bullish Fund (UUP) to see how the dollar is doing.
 (Updated chart)
UUP and the dollar have broken short-term support. The year-long uptrend is also broken. Now, the dollar tests its longer-term Fibonacci support.
A bounce here would be likely. But will the bounce hold?
Meanwhile, you can see how well gold is doing as the dollar weakens. Crude oil is its own story.
(Updated chart)
UUP and the dollar have broken short-term support. The year-long uptrend is also broken. Now, the dollar tests its longer-term Fibonacci support.
A bounce here would be likely. But will the bounce hold?
Meanwhile, you can see how well gold is doing as the dollar weakens. Crude oil is its own story.
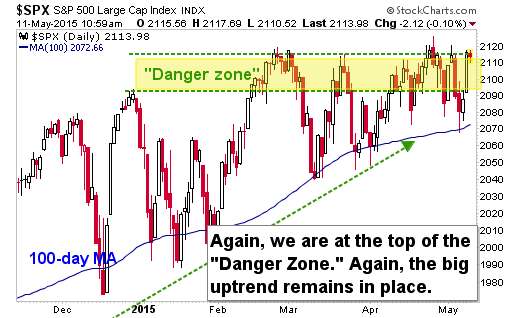
It's "deja vu all over again" -- a famous Yogi Berra quote -- for the S&P 500, as it tests the top of the range that has held it in check since February. If it can't break out today, we're probably going back down to the bottom of the yellow zone, and maybe support at the 100-day moving average.
However, I will point out that earnings are actually showing progress. Fears of an earnings recession are fading. So maybe the S&P 500 can break out.
 (Updated chart)
Stay tuned.
(Updated chart)
Stay tuned.
Looking at a chart of the industrials, you can see an obvious breakout. More conservative investors would want to wait for confirmation. This breakout gives us a target of $75.
 (Updated chart)
Major components of the XLI include General Electric ($GE), 3M Co. ($MMM), Union Pacific ($UNP), United Technologies ($UTX) and Boeing ($BA).
Don't buy something just because a guy on the Internet likes it. Do your own due diligence.
(Updated chart)
Major components of the XLI include General Electric ($GE), 3M Co. ($MMM), Union Pacific ($UNP), United Technologies ($UTX) and Boeing ($BA).
Don't buy something just because a guy on the Internet likes it. Do your own due diligence.