Tuesday, March 31, 2015

The US Dollar Heads Higher #Gold #CrudeOil

The US Dollar Index, as tracked by $UUP, has bounced from support and is heading higher.

Visit StockCharts.com to see more great charts.

(Updated chart)

Irrespective of what happens with Iran, this drags on crude oil prices, because crude is priced in dollars. And rising demand from China is all well and good, but a rising dollar usually weighs on gold as well. 

Monday, March 30, 2015

Energy Looked Good Today: $VDE

We've seen some bullishi developments in the energy sector recently. The latest was that today, while oil prices went down, energy sector stocks led on the way up.

That should be good news for Oxford Resource Explorer subscribers, what with our energy-heavy portfolio. And we recently began dipping our toes in the energy sector in $10 Trigger Alert, with an oil storage stock that was up 4.4% on the day today.

But I wish I had a publication where I could have recommended VDE today. The Vanguard Energy VIPERs looks ready to rock. 

Visit StockCharts.com to see more great charts.
(Updated chart)

That said, more cautious investors will wait and see if VDE A) breaks out and B) then confirms the breakout.

Remember, don't buy anything just because some dude on the internet likes it.  Do your own due diligence.

Updated $SPX chart: Bouncy-Bouncy

Last week, I talked about $SPX testing support. The Market Gods have spoken ...
Visit StockCharts.com to see more great charts.
(Updated chart)

That said, we need the S&P 500 to break out through that overhead resistance it touched in February and March, otherwise it's still just range-bound.

$NATGAS Rolls Over

Look out below. Yeah, $NATGAS looks cheap here, but I'm thinking it can get cheaper. Winter is over, and the build looks bearish going into summer. Sorry, my friends in the biz.


Visit StockCharts.com to see more great charts.
(Updated chart)

Wednesday, March 25, 2015

S&P 500 -- Chart of Bullish Trend

There are many ways to draw a chart of the S&P 500. Here, I look at the intermediate-term uptrend in the S&P 500 SPDRS (SPY), which tracks the S&P 500.


Visit StockCharts.com to see more great charts.

It wouldn't surprise me to see the S&P 500 sell off for another day or even into the end of the week. Support needs to hold at that uptrend. A rally from that level would be a good buying opportunity.

Tuesday, March 24, 2015

Oil Prices and Oil Storage: Why a Price Rally is Difficult

On Tuesday, I read a story titled "10 Charts That Point to an Oil Rebound." At first, I was willing to dismiss the story, especially because it contradicts itself from one paragraph to the next, saying: "The sudden downdraft in oil pricing was caused mainly by Saudi Arabia and the Gulf States" followed by "The U.S. shale boom has been the only real global source of recent supply growth."

Well, which is it?

Hint: He was right the second time. Sort of. Iraq is growing production a lot, too, and until recently, so was Canada. Still, the U.S. is by far top dog in oil production growth.

There's also an older chart from Rystad Energy that confuses oil production costs with oil development costs. And so on.

That's not to say everything in the article is wrong. Some decent points are made. But the bad points ruin the overall analysis.

However, this isn't the only article calling for a rebound -- even a big rebound -- in oil prices. (example 1, example 2) When we start to see a lot of opinion that is contrary to our own, we need to investigate it.

After all, they might be right, and we might wrong. 

First of all, we should separate U.S. crude oil prices from international crude oil prices (Brent, but also other oil benchmarks around the world).

It is true that the global oil glut is only about 1.5 to 2 million barrels per day. A calamity in any of the troubled oil producing nations (Venezuela, Iraq, Iran, Libya, Nigeria, etc) could remove the global glut.

How about the U.S. glut?

US crude oil stocks are soaring. 

The blue line is current stocks at Cushing; the gray zone is the five-year range. Obviously, stocks of crude oil in this country are soaring. Crude oil storage at Cushing, Oklahoma, are up 15 weeks in a row, and reached 54.4 million barrels on March 13, according to EIA's Weekly Petroleum Status Report. This volume (measured in barrels) is the highest on record.

Capacity utilization at Cushing is now 77%, a large increase from a recent low of 27% in October 2014.

But it's not the first time oil in storage has surged. In fact, Cushing reached 91% of capacity back in in March 2011.


There was less storage at the time, so the total number of barrels was lower.

So what happened to oil prices back in 2011? Let's look at a chart ...


(Updated chart)

In fact, 91% storage utilization did not immediately impact prices. Oil prices went up for nearly a month after storage peaked.
Then, however, starting on May 2nd, prices started rolling down the slippery slope. In the space of a few months, they fell by a third. Ouch.

So maybe the lesson here is that oil storage isn't the main driver of prices. Maybe -- or even probably -- the U.S. dollar and speculation are more important.

By the way, look at the bottom of that oil chart, and you can see that RSI, a momentum indicator, is improving. This is why many technical analysts are calling a bottom in the price of the U.S. oil benchmark, West Texas Intermediate crude oil.

Meanwhile, there's the other factor in oil prices: The fact, that, even though the U.S. rig count has fallen for 14 weeks in a row, U.S. crude oil production keeps rising, recently hitting 9.42 million barrels per day.


(chart source)

In fact, production is still way up year over year.


You saw my previous chart on the US dollar and crude. Watch that one closely.

Finally, there's one more important thing we must take into consideration. And that's just how fast Cushing storage is filling up. And that's fast.


The EIA reports: "Cushing inventory levels in the previous two months have changed by about 2.2 million barrels (on a net basis). In previous years, the net weekly changes were more often in the range of 0.5 to 1.0 million barrels either in or out of Cushing."

So, IF storage is a part of the equation, then another big build this week would likely send oil prices lower.

But back to the point, "could oil prices rally and rally big?" Unless the U.S. dollar collapses or production starts falling/storage starts emptying, a real rally in U.S. oil prices is difficult.

New storage numbers come out tomorrow. We'll see. So, up or down? You can place your bets. Or maybe we're entering an "undulating plateau" of oil production.


Wednesday update: Crude Oil Inventories rose by 8.2 million barrels for the week, versus expectations of 5 million. That was down from the previous week's build of 9.6 million barrels, giving bulls a straw to grasp at.

Also, the build at Cushing was 1.9 million barrels -- below the average previous build (at least recently).


 Obviously, with Cushing near its limit, producers are looking to store elsewhere.

One more thing: When oil storage tanks are "full", they aren't full to the tippy-top. The company that builds those tanks says there's another 3% to 5% left at the top to prevent spillage. If that comes into play, that would be potentially more profit for the companies doing the storage, don't you think?

The Chart at the Heart -- Dollar, Crude & Gold

Here's what I'm watching now ...
(Updated chart)

If you're interested in natural resources, keep watching this chart.

Also notice that while the falling dollar may be supporting crude, it is REALLY supporting gold.

Wednesday, March 18, 2015

Like a Thunderbolt, the U.S. Dollar Falls!

Today's U.S. dollar action reminds me of the words of Alfred, Lord Tennyson.

He clasps the crag with crooked hands;
Close to the sun in lonely lands,
Ring'd with the azure world, he stands.

The wrinkled sea beneath him crawls;
He watches from his mountain walls,
And like a thunderbolt he falls.

(Updated chart)
Is this a one-day correction, or a taste of what's to come? What were dollar bulls thinking, anyway? They got squee-ee-ee-eezed!

Gold held up nicely in the latest dollar rally and rebounded hard today. We'll see.

Thursday, March 12, 2015

Director's Cut of "Lick the Competition"

I have a new column for Free Market Cafe/Non-Dollar Report. You can read that here: http://freemarketcafe.com/2015/03/an-alternative-investment-licks-competition-invest-rare-stamps/

It originally had a much different opening, one based on my visit to the Salvador Dali Museum here in St. Petersburg, Florida. Here is the original opening ...

In 1943, Reynolds and Eleanor Morse traveled from their home in Ohio to New York City, where they met the artist Salvador Dali. Dali had moved to New York in 1940 to escape the war in Europe. The Midwestern couple struck up a friendship with the artist. 

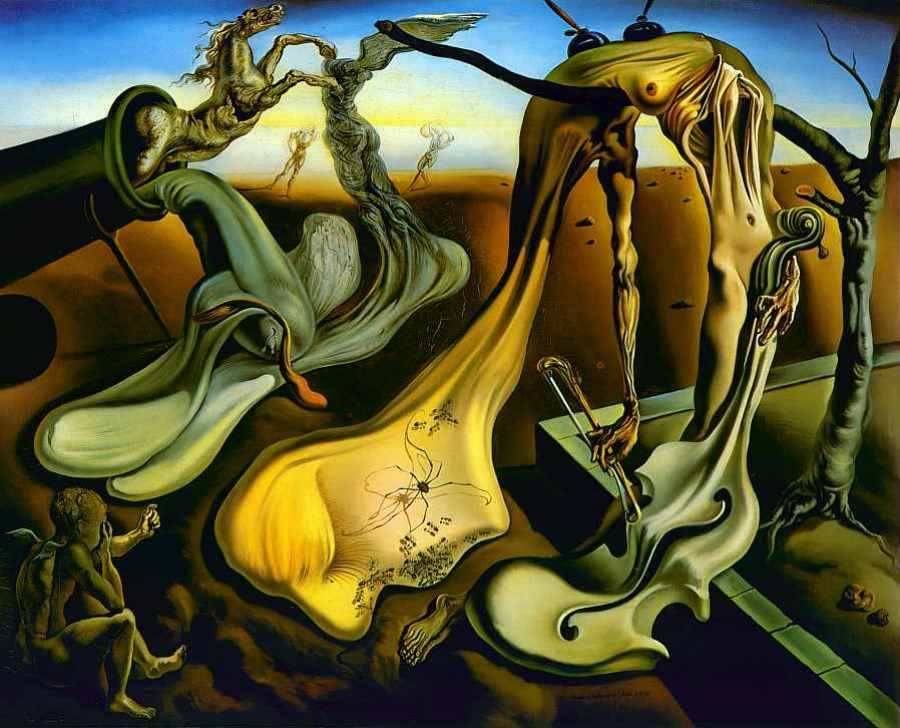
So, as an anniversary gift for themselves. The Morses bought Dali’s painting "Daddy Longlegs of the Evening... Hope!"
 
The painting is rather disturbing – it is an antiwar piece painted by Dali the refugee. It was also an expensive gift – the kind a couple has to think about before buying. It cost the Morses $1,250.

That’s pretty cheap for a Dali, eh?  But it was 1943. The average wage in that time was $2,000 a year.  A new car cost an average $900. Indeed, for a young couple, it was an exorbitant gift, even to themselves.

Fast-forward, and a lesser Dali painting from roughly the same period sold for more than $9 million a few years back.  Daddy Longlegs is a famous painting -- it would probably sell for much more.

Dali’s paintings often contained multiple images, those on the surface and those hidden. There is a hidden story to the purchase of that painting. The hidden story is the way the dollar has been flattened since 1943.

Let’s say the Reynolds hadn’t bought that painting.  Let’s say they wrapped up the money they would have used to buy it -- $1,250 – and unwrapped it in 2015.

Would that have been smart? Was holding the U.S. dollar a good investment over that time?

No. Make that, “Heck No!”

This is why we look for non-dollar investments. 

I’m not going to try to convince you to invest in Dali paintings.  Though the Morses did just that, adding more and more over the years. Now, you can see their collection at the Dali Museum in St. Petersburg, Florida.

No, rather than Dali paintings, I want you to think outside the box. There are many non-dollar investments.  Art, sure. But also, farmland, gold, and what are called “rare tangible investments.”


We’ll talk about one of those rare tangible investments today: Rare stamps.


You can see my interview with Geoff Anandappa, who I mention in the article, here: https://www.youtube.com/watch?v=gb08DcJA-Dw

Friday, March 6, 2015

Chart of the Day -- Global Deflation

This is the change in proportion of countries with hyperinflation (blue line) vs. the change in proportion of countries with deflation (red line) over the past 40 years.

source: Callum Thomas

Thursday, March 5, 2015

Fibonacci Sequence in Music - Bence Peter


Here's a nice little interlude for your busy Thursday

Chart of the Day -- US Dollar and Gold

The US Dollar Index hit a new 11-year high yesterday. This was mainly due to positioning ahead of today's European Central Bank announcement, so there may be a whiplash. But the bottom line is King Dollar continues to show strength.

With the dollar making an 11-year high, you might expect gold to be making new lows. After all, gold is priced in dollars. But, no, while gold is testing support around $1,200, it's actually holding above lows hit in the last quarter of 2014
(Updated chart)

So, what does this mean? I'll be sending a new report on gold to $10 Trigger Alert subscribers soon; I'll lay my cards on the table at that time.

Be careful, but also be ready to seize opportunities.

Wednesday, March 4, 2015

You Really Might Want to Be Short Bonds Here

It looks like US 20-year Treasuries are threatening to break down.


Why would they be doing that? Well, part of what was driving Treasury prices was that they traded in sympathy to "risk assets" in Europe. But now, for the first time in a long time, Europe seems to be getting its act in gear. Fears of a deflationary spiral in Europe are easing. Retail sales in Germany almost tripled in January. 

So, with Europe improving, less people are rushing into US Treasuries for safety. You can see how the iShares 20-year Treasury Bond Fund tried to rally off a trend line, and now seems to be falling again? 

So what's an investor to do? Well, the ProShares UltraShort 20-year Treasury Fund (TBT) goes in the opposite direction of Treasuries. In fact, it's a leveraged fund.


Just an idea for this Wednesday. Do your own due diligence, and don't buy something just because a guy on the Internet says it's a good idea.

Good luck and good trades.