Some charts from the Energy Information Administration on U.S. energy consumption and imports are eyepopping.
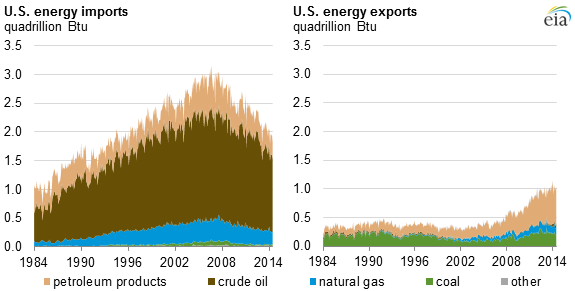
First, total U.S. net imports of energy as a share of energy consumption fell to their lowest level in 29 years for the first six months of 2014.
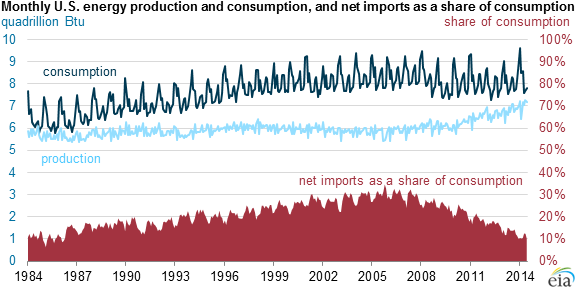
If you're wondering how the rise in U.S. energy production breaks down, petroleum accounted for 52% of the 2014 year-to-date increase, natural gas for 27%, renewable energy for 9%, and nuclear electric power for 2%. In contrast, total coal production fell 1%.
Read the whole EIA report HERE.
Meanwhile, there is support for the U.S. oil benchmark, West Texas Intermediate, around $75 per barrel.
And here is a chart showing breakeven prices among the U.S. shale plays. Notice that the costs in the Eagle Ford are generally a lot lower than in the Permian.
Also, crude oil processing volumes in China reached a record high. However, Chinese refiners are facing a "triple whammy" -- slowing economic growth, state price controls, and now a plunge in the value of stockpiled petroleum.
Just some things to keep in mind today.
And let's look at that oil price chart one more time.

(Updated chart)
A bounce looks likely, but there's no law saying it has to happen.
have a good Tuesday,
Sean
No comments:
Post a Comment