Friday, September 12, 2014

Friday Update: India Gold, Russian Oil, Crystals in a Silver Mine & More

Today, I recommended Gold & Resource Trader subscribers grab small gains on a double-inverse oil ETF. We'll see if it's the right or wrong thing to do. In other news ...

India's June Gold Import Highest in 12 Months
Despite the fact the new Indian government, led by Narandra Modi since May, hasn't lowered the import duties on both gold and silver, Indians keep on buying precious metals. Despite the fact we already knew this, there was less gold being smuggled into the country and more imported through official channels last June; 77 tonnes were gross imported, which is up 48 % from a month earlier, and up 75 % from June last year. This was accompanied by falling premiums.

Retail Sales Rise Broadly
U.S. retail sales rose broadly in August and consumer sentiment hit a 14-month high in September, which should ease concerns about consumer spending and support expectations for sturdy growth in the third quarter.

Solar Storms Sending Biggest Threats to Earth Today and Tomorrow
The U.S. Space Weather Prediction Center is tracking two coronal mass ejections, “huge expulsions of magnetic field and plasma”. Earth should be spared the most crippling impacts of these kinds of events, which can include disruptions to electric grids and radiation strong enough to cause polar flights to change routes.

With oil under $100, China trader books world's largest ship to store crude
A Chinese trading firm has booked the world's largest super-tanker to store crude at sea, adding to a growing flotilla of vessels used for floating storage as benchmark oil prices slip below $100 a barrel.

Blowback: Sanctions against Russia threaten Exxon deal with Russia's Rosneft to drill in Arctic.

When Will the Fed Raise Rates?

The market now expects the Fed to start raising rates in Q3 of next year.


Photo of the Day
There is a silver mine in Mexico that grows giant crystals, as big as 50 feet long and 4 feet wide.

The crystals are formed by hydrothermal fluids rising from the magma chambers below.

Have a good weekend.

Thursday, September 11, 2014

Adrift and Guns Blazing

Thought for the day ...

"President Obama is allowing himself to be drawn back into the very war that he once correctly denounced as stupid and unnecessary — mostly because he and his advisers don’t know what else to do. Bombing has become his administration’s default option.

"Rudderless and without a compass, the American ship of state continues to drift, guns blazing."

Read the rest (and weep) ...

Update: Here is a link to the full article by Andrew J. Bacevich, the Boston University political science professor and former Army colonel who lost his son in the Iraq war in 2007: Obama is picking his targets in Iraq and Syria while missing the point

“We are At War now — with somebody — and we will stay At War with that mysterious Enemy for the rest of our lives.” — Hunter S. Thompson

Thursday Links and US Oil Production Chart

US Crude Oil Production Will Surge to a 45-Year-High Next Year
The U.S. Energy Information Administration raised its estimate of 2015 output by 250,000 barrels a day to 9.53 million, the most since 1970, Adam Sieminski, the administrator of the EIA, said in a statement yesterday. The agency forecast output of 8.53 million barrels a day this year, up from 7.45 million in 2013.


Global oil supplies are expected to grow by 1.3 million barrels a day in 2015, with output growth in the United States accounting for about 91 percent of that,

Note: The EIA's current forecast for 2014 is 8.53 million bpd, up from 7.45 million bpd in 2013.

Nat-Gas Inventories Rise, But Still Below Range
U.S. nat-gas in storage rose 92 bcf on Friday to 2,801 bcf. But that's still 443 Bcf less than last year at this time and 463 Bcf below the 5-year average of 3,264 Bcf.


INTERESTING FACTOID: The proportion of Canadian bitumen (tar sands) produced with steam now stands at 53% and will continue to grow.

Note: More steam means less strip-mining. But you're still using the cleanest fossil fuel (nat-gas) to produce one of the dirtiest (bitumen, dirtiest next to coal).

When Ranking The Best Gold And Silver Stock ETFs, GDXJ Comes Out On Top

  • For investors looking for exposure to the mining sector, ETFs provide a solid alternative to individual stocks.
  • When ranking all of the different ETF options, GDXJ comes out on top.
  • SIL is also solid choice and it compliments GDXJ nicely.
Note: When miners and mining ETFs are drifting lower, this is small comfort.

Gold Falls to 7-Mo. Low on U.S. Outlook as Platinum Slips. See also: The surging U.S. dollar index is another bearish underlying factor for the raw commodity sector. The dollar index is at a 14-month high. Most major raw commodities are priced in U.S. dollars on the world markets. When the greenback appreciates against the other currencies, it makes commodities priced in dollars more expensive to purchase with those currencies.

Wednesday, September 10, 2014

Top Stories and Charts on Energy and Gold for Wednesday

OPEC Says World Will Need Less of Its Oil Next Year
OPEC said demand for its crude oil will be lower than expected next year, with a surge in U.S. output potentially bringing its production to levels not seen since the past decade.

In its monthly oil-market report, the Organization of the Petroleum Exporting Countries said it had lowered the estimate of demand for its crude by 200,000 barrels a day for 2015 and by the same amount for this year. As a result, markets will need 300,000 barrels a day less of OPEC crude next year, it said.

The new OPEC demand forecast would bring its expected production next year to 29.2 million barrels a day, a level not see since the group was forced to slash its output in 2009 following a global financial crisis.

Despite lower demand for its crude, OPEC said its production rose by 231,000 barrels a day in August as Libyan oil ports and fields reopened.

READ

Commodities Fall to 8-Month Low as Brent Stays Below $100
The Bloomberg Commodity Index of 22 raw materials fell 0.3 percent by 3:24 p.m. in London after earlier declining 0.4 percent to 122.9665, the lowest since Jan. 10. The gauge declined 2.1 percent this year. Brent oil traded below $100 a barrel for a third day.

Commodities are heading for a fourth annual decline as rallying stock markets and a strengthening dollar curbed demand for an alternative investment. Oil prices are set to drop next year as U.S. crude output reaches a 45-year high, the Energy Information Administration said yesterday. The U.S. corn crop is a record high, the U.S. Department of Agriculture forecast.

READ

Cheapest US Gasoline Since 2010 Set to Get Cheaper
The average is $3.428 a gallon, down 6.2 percent since Memorial Day on May 26, AAA data show. That’s the largest decline from the start of the summer driving season since 2008. U.S. refineries operated at the highest-ever seasonal rates every week since July 4.

Processors are using domestic crude that costs less than foreign imports as horizontal drilling and hydraulic fracturing in shale formations increased output to the most since 1986. Gasoline will drop another 10 to 20 cents a gallon by the end of October as retailers switch to cheaper winter-blend fuel, said Michael Green, a Washington-based spokesman for AAA, the largest U.S. motoring group.

READ

Oil Prices That Major Producers Need to Survive


READ

Gold Advances as Drop to 3-Month Low Spurs More Buying
Assets in gold-backed exchange-traded products rose by 2.2 metric tons yesterday, snapping a six-session slide. Bullion earlier touched a three-month low. The price slump will help attract physical buyers, Abhishek Chinchalkar, an analyst at Mumbai-based AnandRathi Commodities Ltd., said in a report today.

READ

Goldcorp: We have hit PEAK gold
The CEO of the world's most valuable gold miner Goldcorp (TSE:G) says "peak gold" will be reached this year or in 2015.

Chuck Jeannes told the Wall Street Journal global gold production will start to decline "as easy-to-mine gold deposits become harder to find" and in the absence of any major technological breakthrough.

The amount of gold discovered and the number of major discoveries (defined as any deposit with a minimum of 2 million ounces of contained gold) have been trending downward over time, from 1.1 billion ounces in 124 deposits discovered during the 1990s to only 605 million ounces in 93 deposits discovered since 2000.


The time it takes to bring a deposit into production is also increasing significantly, slowing the rate at which production is replaced. Between 1985 and 1995, 27 mines with confirmed discovery dates began production an average of eight years from the time of discovery. The time from discovery to production increased to 11 years for 57 new mines between 1996 and 2005, and to 18 years for 111 new mines between 2006 and 2013.


READ

SEE ALSO

Investors, Speculators Leaving Gold Market In Droves
Precious metals investors poured money into the sector during July, but renewed selling in August only accelerated into September.

Global exchange traded funds backed by physical gold saw outflows last week of 13.4 tonnes, dropping total holdings to 1,713 tonnes, perilously close to four-year lows of 1,708 reached in June.

Some 17 tonnes left during August and that compares to inflows in July which was the best since November 2012. Year to date roughly 50 tonnes have left the dozens of funds traded around the globe and investment bank Barclays believes 100 tonnes could exit the market in 2014.

Gold ETFs saw outflows last week of 13.4 tonnes, dropping total holdings perilously close to four-year lows reached in June

Gold bullion holdings in global ETFs hit a record 2,632 tonnes or 93 million ounces in December 2012, but last year saw net redemptions of 800 tonnes.

READ

Yamana Temporarily Suspends Ramp-Up Activities At C1 Santa Luz
Yamana Gold will temporarily suspend ramp-up activities at its C1 Santa Luz mine, located in Brazil, and place it on care and maintenance. “The decision to temporarily suspend ramp-up activities at C1 Santa Luz and put it on care and maintenance is consistent with the company's focus on maximizing cash flow rather than production only and protects the significant inventory of mineral resources that that would otherwise likely be lost permanently to tailings with the current recovery levels,” Yamana says.

“In so doing, the potential future viability of the project is preserved as that inventory is profitably mined and recovered utilizing one of the metallurgical processes that will be implemented once the evaluation process is completed.”

The company says they will be evaluating the mine with an “alternative metallurgical recovery processes before end of 2015.

Yamana does not expect a large impact on its 2014 gold equivalent production guidance of 1.42 million ounces at all-in sustaining cash costs between $825 and $875.

READ


NON-MARKET NEWS

Scientists find mysterious species that defy all classifications of life

Science Explains Why Beer Is The Liquid That Fuels Civilization

The Start-to-Finish Guide to Securing Your Cloud Storage

Why China's Building a Military Base in the Middle of the Ocean

“Fists In the Mouth of the Beast”: On Irish Folklore

The 10 Most Underrated Jobs Of 2014

Saturday, September 6, 2014

Oil Charts and Analysis

Oil 
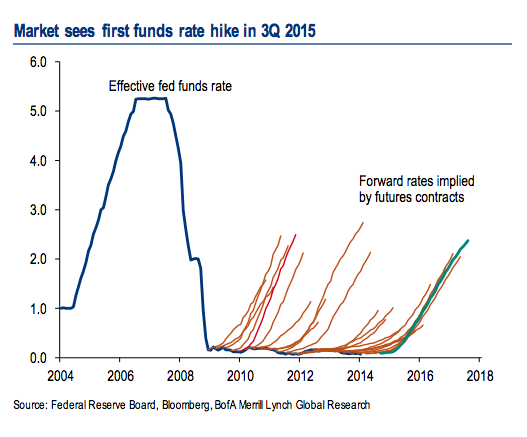
investors got gob-smacked earlier this week when oil fell below $93 a barrel. The drop was blamed on a rise in global supply. Supply is rising, and that’s putting downward pressure on oil prices. The low of $92.50 on August 21 is important, so watch support there.


(Updated chart)
Here’s the good thing: There can be energy winners even when prices are in a short-term downtrend. Heck, there can be energy winners even if the downtrend is MORE than short-term.

I’ll explain. Earlier this week, I poured through energy industry reports, and some of the numbers on U.S. production were just stunning.


Here are some of the facts that crossed my path.
  • The Energy Information Administration reported U.S. oil output through June. It turns out topped 8.5 million barrels per day for the first time in 28 years. That’s a surge of 18% year over year.
  • Meanwhile, U.S. net petroleum imports in June came in at 4.66 million barrels per day. That’s the lowest – EVER – in the post-shale era.
  • Also, natural gas production is up as well. According to the EIA, from the week ending on April 4 through the week ending on August 22, net storage injections totaled 1,808 bcf. That’s up 27% from the same period last year. And it’s well ahead of the five-year average.
  • Nonetheless, nat-gas in storage dipped so low during the harsh winter that inventories are expected to be below the five-year average when injection season ends on October 31.
Obviously, the U.S. is producing a tremendous amount of oil and gas. This means there will be winners and losers. And they might not be the ones you think.

I find it likely that many of the losers will be high-cost producers. If they’re pouring product into a flooded market, profit margins will squeeze lower. On the other hand, low-cost producers should continue to do well IF they can keep raising production.

The winners will come in a number of areas.

Transportation: This includes railroads, pipelines and tankers. All that product needs to be moved from the pump to refineries and other distribution centers.

Not all transportation companies will be winners. But those serving booming oil and gas fields will do well. 
  • The U.S. Energy Information Administration expects that the Eagle Ford Shale produced 1.5 million barrels of crude oil and other liquids daily in July. That’s 411,000 more than a year earlier. Production should keep rising in August and September.
  • The Permian Basin is expected to produce 1.72 million barrels daily in September, up 38,000 barrels in a month. It made about 1.4 million daily barrels last year in September.
  • North Dakota’s Bakken produced 1.2 million barrels per day in July, up 280,000 from a year earlier.

These are just the current leading fields in U.S. oil and gas production. There will be others.

For example, I expect we’re about to see a boom on Alaska’s North Slope. When I was in Deadhorse, Alaska a few weeks ago, the town was a beehive of activity. And it exists for one reason: To service oil and gas drilling and production on the North Slope.

And the U.S. Gulf of Mexico is about to see its oil and gas production get a second wind, as the government has auctioned off hundreds of thousands of acres to eager companies.

Every drop of oil and gas that is produced needs to be transported. Keep that in mind.

End-Users: If prices will remain under pressure in the short-term, we could see strong rallies in companies that use a lot of fuel. This includes chemical manufacturers, airlines and shipping companies.

It also includes automobile manufacturers that have lots of higher-end, gas-guzzling vehicles to sell. Recreational boat manufacturers should also do well.

Oil Services Companies. Oil and gas producers need to squeeze every dollar they can out of production. The way to do that is to hire select oilfield services companies that get them more bang for their buck. In North Dakota, the active oil rig count is close to 200 and the highest level in nearly two years.

So, select drilling and oilfield services companies could do very big business.
There are plenty of ways to play this trend. I’m already recommending new picks to my Oxford Resource Explorer and Gold & Resource Trader subscribers.

If you’re doing this on your own, remember to do your own due diligence.

Saturday Charts - Unemployment, Marijuana, Bird Deaths, Euro

1. UNEMPLOYMENT

Nick Timirados at the Wall Street Journal takes a look at unemployment in six charts. Here are two of them.


Click HERE to see the rest.

2. MARIJUANA IS SAFER THAN ALCOHOL


The figures clearly show that on a per-user basis, marijuana is considerably less likely to send you to the E.R. than heroin, cocaine or meth. Marijuana users are also 75 percent less likely to face an E.R. visit than prescription drug abusers.
For the rest, CLICK HERE.

3. BIRD DEATHS BY ENERGY SOURCE

Results show that even with high-range estimates for renewables compared to low-range estimates for fossil fuels, fossil fuels are responsible for far more bird fatalities than solar or wind.
For the rest CLICK HERE.

4. HOW THE EURO HURTS EUROPE

Here's a chart of European Industrial production since the introduction of the euro.

As you can see, Germany expands as others contract.

Friday, September 5, 2014

Friday Update -- Chart on the Dollar and More

Gold miners got hammered this week, and we had to take another round of gains in Gold & Resource Trader as another raised stop was hit.

I think gold's weakness has a lot to do with physical demand from China cooling off as that country's anti-corruption campaign heats up. They'll be back. And meanwhile, yesterday's dip spurred physical demand.

But the drop in gold prices also has to do with strength in the US dollar. Remember, gold is priced in dollars. As one goes up, the other usually goes down.

First, here's a chart of the US dollar ...

(Updated chart)

The US dollar is on the path to test its highs from last year. The wind beneath its wings is the collapse of the euro, triggered by eurozone stimulus.

August jobs numbers generally sucked. This was expected. And here's a big part of the reason why.

A major New England grocery store chain shut down last month due to a strike. The strike is over. One would think that will help the next round of job numbers.

Overseas, the population of Russia is plummeting like it is suffering a major catastrophe or world war. And no, Ukraine doesn't count. People are generally miserable as the oligarchs squeeze them mercilessly.  A lesson for our own ruling class, not that they care.

Freeport McMoRan reached a deal with the government of Indonesia; laying out a roadmap for how the mining industry in that country could get back on track.

The US imported 878,000 barrels of Saudi crude a day in August, the least since 2009. This chart from InvestmentU tells the real story.


 I'll have more on America's energy production tomorrow. Have a good weekend.

Tuesday, September 2, 2014

5 Must-Reads for Tuesday: Gold, China, India, Cyberspying and More!

1. Factoid for the day ...
After the Second World War the U.S. earned 50% of the globe’s cash flow. As the developed world recovered, its share of global cash flow rose to 80% by the turn of the century. This is changing rapidly. China now has 40% of that cash flow and the entire ‘emerging’ world will command 65% of this cash flow sometime between 2016 and 2020 with the developed world earning 35% of the global cash flow.

2. India Outpacing China’s Oil Demand

India’s oil demand has shown steady growth through July at an average of 3%, or 101,000 barrels a day. China’s oil demand has declined at an average of 0.6%, or 62,000 barrel a day.

In absolute terms China is Asia’s largest oil consumer, having burned 10.76 million barrels a day of oil and accounting for 12.1% of global oil consumption in 2013, according to BP PLC. The second-largest oil consumer in Asia is Japan, though its oil consumption has been declining as its economy has matured. 

India ranks third at 3.7 million barrels a day and accounted for about 4.2% of global oil consumption in 2013. 

3. Gold Investment Positive last month, But Only Just

Argentina's default, the death toll in Gaza, LOL jihadis in Iraq...nothing shook gold from its summer slumber. In case you missed it – because you passed out with boredom – this is how tedious precious metals became in August 2014...

  • Gold traded in the narrowest monthly price range for five years, a mere $40 per ounce;
  • The monthly average price of $1296 was almost precisely the average gold price of the previous 12 months ($1297.50);
  • Speculators and commercial traders both cut their holdings of Comex futures & options. In fact, open interest (ie, the number of contracts now open) fell to a series of 5-year lows;
  • Investment funds also shrugged and took to the beach. The giant SPDR Gold Trust (GLD) shrank by 6 tonnes, reversing July's addition and erasing all 2014 growth so far at 795 tonnes – a 5-year low when first hit this January.

See also: 3 Important Gold Charts

4. Phony Cell Towers Could Be Intercepting Your Data 

Les Goldsmith, the CEO of ESD America, the company that makes the super-secure CryptoPhone 500, found 17 phony towers around the U.S. in July alone. No one knows for sure who's running them, Goldsmith tells Popular Science.

"What we find suspicious is that a lot of these interceptors are right on top of U.S. military bases. So we begin to wonder – are some of them U.S. government interceptors? Or are some of them Chinese interceptors?" he says.

5. Morgan Stanley: The Market Could Rally For Years, And The S&P Might Go To 3,000

"We believe a prolonged period of deleveraging in the U.S., coupled with an uneven global recovery, are just two of the reasons why this could prove to be the longest US expansion — ever," he writes.